SCARY FACTS - THE ELECTRICITY REALITY
ESKOM IS INCREASING RATES AT 16% FROM 2013 FOR THE NEXT 5 YEARS
For example using Groblersdal farming rates are presently R1.1345 KW/H; this means in 2017 it will be R2.0541 KW/H.
If Eskom then increases its rates at 20% per annum this figure will increase to R5.1113 KW/H by 2022
• Eskom is at least 15 years away from instituting inflation-cost tariff increases, as the power utility says it needs 16% increases for the next five years, followed by a similar period of 20% increases with a final five years of 9% increases.
• Eskom chief financial officer Paul O’Flaherty said these increases were based on the assumption that Eskom generated 65% of the country’s electricity needs and independent power producers (IPPs), the remainder using mainly renewable energy sources.
• In the interim, however, a framework for the introduction of a carbon tax was announced in the 2012 Budget Speech together with the proposal that a carbon tax be implemented in 2013/2014 at a rate of R120 per ton of carbon tax equivalent (CO2e) on direct emissions.
Impact Of Constant Price Rise
A carbon tax as being proposed by National Treasury will wreak havoc on the South Africa economy and will make it uncompetitive. Per the Budget documentation a rate of R120 per tonne of carbon dioxide (CO2) emissions is suggested as a carbon tax. A tax free threshold of at least 60% will apply.
At the current rate Eskom will pay R11 billion per annum when the carbon tax is implemented, with escalations of 10% until 2020.
The above number does not take into account the implicit carbon tax already built into the electricity price for renewal energies and energy efficiency incentives administered by Eskom for which the country is already paying. Eskom in terms of its current pricing model will pass the additional tax onto consumers and thereby increase the price of electricity even further.
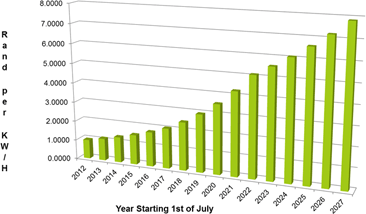
The impact on a constant price rise of 16% p.a. for 5 years then a 20 % p.a. for a period of 5 years and thereafter a 9% p.a. for 5 years - market related increases will be as follows:
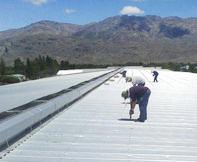
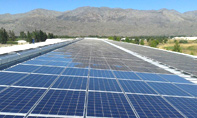
What does the system consist of:
Solar Panel Kits:
Starting at 54 x 240W panels for three phase systems and 9 x 180W panels for single phase systems
Inverter:
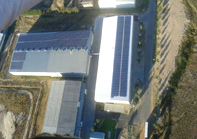
Mounting frame for flat or pitched roofs as well as open space.

Technical data
Technical data and performance of the 154 x 240W panel kit over life span:
• Nominal AC Power 34 KW/H
• Daily AC Power 205.7 KW/H
• NASA average hours of sunshine per day over a period of 365 days for Bloemfontein = 6.05 hours
Impact of solar usage: Input
The Impact of supplementing your electricity usage with solar electricity:
• Make use of a 154 Panel kit
• Ave electricity usage is 238.60 KW/H per day
• System finance at 8.5% p.a. over 5 years
• Performance is based over a period of 30 years with a ave. decline in efficiency of 0.778% per year on the panels
• Total costs includes Capital Interest on loan over 5 years and installation costs
Impact of solar usage: Output
The Impact of supplementing your electricity usage with solar electricity:
• Internal rate on return over a 30 year period is 50.47%
• Net present value of the investment and 30 years of saving is R 5 698 601@ a 10% interest rate before tax; tax benefits included
• VAT not included
• Re-payment period of the investment is ± 5 years
• The value of Carbon Credits and re-selling back into the grid are not included